
As multi-cloud and hybrid environments continue to scale, it’s imperative to get control of your data and confidently assess your data risk posture. Your current data security stack may provide some insights about your data risk, but not in the context needed to make effective decisions. Many of us are visual learners —about 65% to be exact. Visualizing data has been proven to illuminate insights and provide clear takeaways faster than a number-filled spreadsheet.
On top of this, you’re likely bombarded with more alerts, notifications, and potential security incidents than ever before. How do you separate the real issues that require your attention from the noise? The lack of visualization coupled with the inability to prioritize your remediation efforts effectively is a recipe for disaster
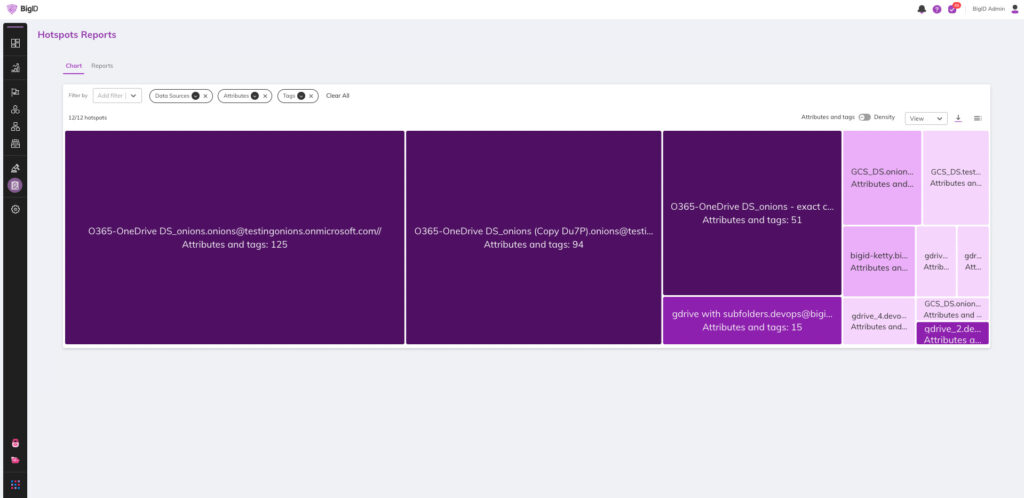
It’s why we created Sensitivity Hotspot Reporting —giving you the power to identify, prioritize, and remediate your riskiest data through rich data sensitivity visualization and reporting. Work faster, reduce data risk, and always be on top of your data remediation efforts to mitigate unwanted data exposure.
Expedite Your Security Operations
Work faster to identify and prioritize your most vulnerable data. Get a better handle on your remediation efforts by cutting through the noise with visualizations of your riskiest data hotspots. Automatically develop a visually intuitive map of your sensitive hotspots across all of your data, regardless of where it lives. For example, understand which data sources contain the largest number of findings, or find the largest sensitive data sets with overprivileged access. Then prioritize accordingly to fix the most pressing issues first with speed and precision.
Proactively Reduce Data Risk
Teams that have robust reporting capabilities are the ones that are able to take action and effectively reduce data risk proactively. Sensitivity Hotspot Reporting, as well as BigID’s other reporting capabilities, are geared toward helping you close the gap between insight and action. By automatically, and visually, pinpointing and prioritizing our biggest sensitive data vulnerabilities, quickly mitigate exposure issues and reduce your risk profile. BigID’s reporting and insights help you measure and assess risk reduction over time from your remediation actions taken —whether you’re minimizing, deleting, encrypting, or masking data.
Adaptable To Your Needs
BigID uses cutting-edge, ML-based classification, labeling, and tagging to create and populate an automated, current, and complete (ie. self-healing) data inventory with a number of attributes that feed into your Hotspot Reporting. Look across any attribute, label, or tag (such as sensitivity or open access) —or create ones unique to your organization’s data.
Define your Sensitivity Hotspots the way you want —by finding count, density in a given data source, or concentration within a given file or folder. Add Sensitivity Hotspot Reporting to any existing dashboard within BigID, or simply view it separately as a widget within the console.
BigID helps organizations of all sizes manage, protect, and get more value out of their data anywhere it exists — on-prem or in the cloud. Enhance your sensitivity intelligence with Sensitivity Hotspot Reporting to visualize and remediate your riskiest data with ease. Get a 1:1 demo to see it in action today!