
Unveiling the Power of Data Profiling: A Comprehensive Guide
Data profiling is a powerful technique for today’s organizations, offering profound insights into the depths of your datasets. For data privacy, security, and governance leaders, mastering data profiling is not just an option—it’s a necessity for steering organizations towards success while navigating the intricate landscapes of privacy and compliance.
What is Data Profiling?
Data profiling is the systematic analysis of data to uncover its structure, quality, and content. It involves examining various attributes within datasets to understand patterns, relationships, and anomalies. By scrutinizing data elements such as completeness, consistency, and accuracy, organizations can gain comprehensive insights into their data assets.
The Importance of Data Profiling
In the realm of business agility and growth, data profiling serves as a catalyst for informed decision-making. Organizations can streamline processes, enhance data quality, and unlock hidden opportunities by illuminating data characteristics and discrepancies. With accurate insights, businesses can pivot swiftly, adapt to market dynamics, and drive innovation.
How Data Profiling Impacts Business Agility and Growth
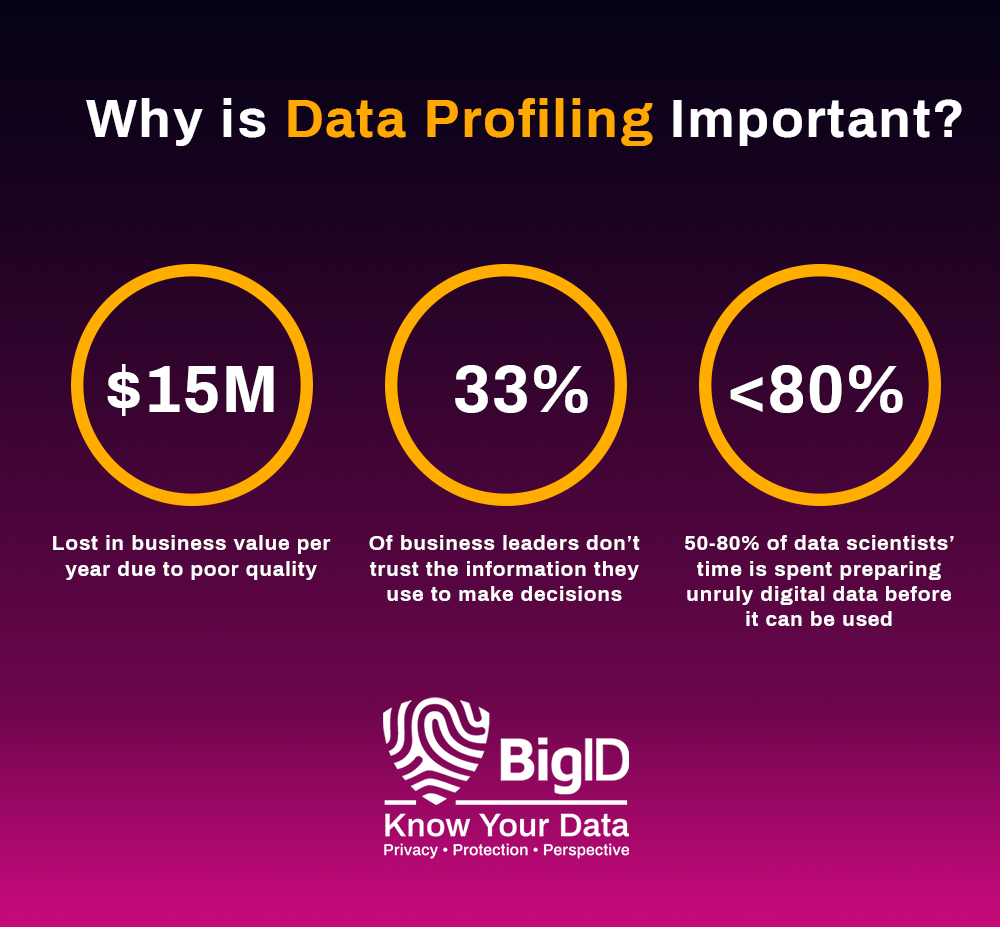
Statistics reveal the profound impact of data profiling on business agility and growth:
- According to Gartner, by 2025, 80% of organizations will initiate data profiling activities to improve the quality of their data assets.
- A study by Forbes found that companies leveraging data profiling experience a 10-20% increase in operational efficiency.
- Research by McKinsey highlights that data-driven organizations are 23 times more likely to acquire customers, six times as likely to retain customers, and 19 times more likely to be profitable.
Types of Data Used for Data Profiling
Data profiling encompasses diverse types of data, including:
- Structured Data: Traditional relational databases containing organized and labeled data.
- Semi-Structured Data: Formats like JSON and XML, with some organizational properties but not strict schemas.
- Unstructured Data: Textual data from sources like social media, emails, and documents, requiring advanced analysis techniques.
Examples of Data Profiling
- Customer Segmentation: Profiling customer data to identify segments based on demographics, behavior, and preferences.
- Fraud Detection: Analyzing transactional data to detect suspicious patterns indicative of fraudulent activities.
- Data Cleansing: Identifying and rectifying inconsistencies and errors within datasets to improve data quality.
Profiling Frameworks and Best Practices
Adopting robust profiling frameworks and best practices ensures effective data management:
- Define Objectives: Clearly articulate the goals and scope of data profiling initiatives.
- Select Appropriate Tools: Choose profiling tools that align with organizational needs, considering factors like scalability and integration capabilities.
- Establish Data Governance: Implement policies and procedures to govern data profiling activities, ensuring compliance and accountability.
Privacy Requirements and Violations
While data profiling empowers organizations, it also raises pertinent privacy concerns.
Data profiling plays a crucial role in discovering, classifying, and protecting Personally Identifiable Information (PII) and Personal Health Information (PHI), collectively referred to as sensitive data. These data types are subject to stringent privacy regulations such as GDPR, CCPA, and HIPAA, mandating organizations to implement robust measures for their protection.
Unauthorized or unethical data profiling can lead to privacy violations, tarnishing brand reputation and inviting legal repercussions.
Here’s how data profiling contributes to this endeavor:
Discovering Sensitive Data
Data profiling techniques involve comprehensive analysis of datasets, including attributes such as data types, patterns, and relationships. Through systematic examination, organizations can identify data elements that potentially contain PII or PHI. This discovery process is essential for understanding the scope and distribution of sensitive data across different systems and repositories.
Classifying Sensitive Data
Once sensitive data is discovered, data profiling facilitates its classification based on predefined criteria. By analyzing various attributes such as data format, context, and usage patterns, organizations can categorize data elements as PII, PHI, or non-sensitive information. Classification frameworks help establish clear guidelines for handling sensitive data, ensuring appropriate safeguards and access controls are applied.
Protecting PII and PHI
Data profiling enables organizations to implement targeted measures to protect PII and PHI effectively. Here’s how:
- Access Control: Profiling helps identify who has access to sensitive data and under what circumstances. By understanding data usage patterns and access privileges, organizations can enforce role-based access controls and limit exposure to authorized personnel only.
- Anonymization and Masking: Profiling insights guide the anonymization or masking of sensitive data to prevent unauthorized disclosure. By selectively obscuring or substituting identifiable information, organizations maintain data utility while minimizing privacy risks.
- Data Encryption: Profiling aids in identifying data elements that require encryption to safeguard confidentiality. By encrypting PII and PHI both at rest and in transit, organizations ensure data remains secure even in the event of unauthorized access or breaches.
- Monitoring and Auditing: Profiling enables continuous monitoring of sensitive data usage and activity. By tracking data flows, access patterns, and modifications, organizations can detect anomalies and potential breaches in real-time, facilitating timely intervention and remediation.
Benefits of Data Profiling for PII and PHI Protection
Granular Visibility
Data profiling provides granular visibility into sensitive data attributes, enabling organizations to make informed decisions regarding data protection strategies.
Risk Mitigation
By identifying and classifying PII and PHI, organizations can proactively mitigate privacy risks and comply with regulatory requirements, avoiding potential fines and penalties.
Operational Efficiency
Profiling streamlines data protection processes by automating the identification, classification, and monitoring of sensitive data, reducing manual efforts and minimizing human error.
Enhanced Compliance
Data profiling ensures adherence to privacy regulations by facilitating accurate reporting, audit trails, and documentation of data protection measures, bolstering organizational compliance posture.
Data Profiling Tools and Considerations
Choosing the right data profiling tools is essential for organizations seeking to derive actionable insights from their data while maintaining efficiency and accuracy.
Consider the following key factors when evaluating data profiling tools:
Scalability
Scalability is crucial, especially for organizations dealing with large volumes of data. The selected tool should be capable of handling massive datasets efficiently without compromising performance. Assess the tool’s ability to scale both vertically (handling increased data volume within the same system) and horizontally (distributing workload across multiple systems or nodes).
Flexibility
Data comes in various formats and structures, including structured, semi-structured, and unstructured data. Choose a profiling tool that offers flexibility to analyze diverse data types effectively. Look for features that support parsing, schema inference, and customization to adapt to different data sources and formats seamlessly.
Security
Data security is paramount, particularly when dealing with sensitive information. Prioritize tools that incorporate robust security measures to safeguard data integrity and confidentiality. Features like encryption, role-based access controls, and audit trails ensure data remains protected throughout the profiling process.
Integration
Seamless integration with existing data management systems and workflows is essential for maximizing efficiency and minimizing disruptions. Evaluate the tool’s compatibility with common data storage platforms, databases, and ETL (Extract, Transform, Load) tools. Look for APIs and connectors that facilitate smooth data exchange and interoperability.
Ease of Use
User-friendly interfaces and intuitive workflows are critical for enhancing productivity and user adoption. Choose tools that offer a streamlined user experience, with features like interactive visualizations, drag-and-drop functionality, and customizable dashboards. Training and support resources should also be readily available to assist users in leveraging the tool effectively.
Automation and Customization
Automation capabilities streamline the data profiling process, reducing manual effort and accelerating analysis. Look for tools that offer automated profiling tasks such as data discovery, attribute inference, and anomaly detection. Additionally, assess the tool’s customization options, allowing users to tailor profiling tasks and algorithms to suit specific requirements and objectives.
Performance and Reliability
Reliability is paramount in data profiling, ensuring consistent and accurate results. Evaluate the tool’s performance metrics, including processing speed, resource utilization, and error handling capabilities. Look for tools that undergo rigorous testing and have a proven track record of reliability in real-world deployments.
Cost and Licensing
Consider the total cost of ownership, including licensing fees, subscription models, and additional costs for maintenance and support. Compare pricing plans and licensing options to determine the most cost-effective solution that aligns with your budgetary constraints and long-term scalability requirements.
Community and Support
Access to a vibrant user community and comprehensive support resources can be invaluable when using data profiling tools. Evaluate the vendor’s reputation, customer reviews, and availability of documentation, tutorials, and forums. Responsive technical support and ongoing updates ensure users receive timely assistance and benefit from the latest features and enhancements.
In conclusion, selecting the right data profiling tool is a strategic decision that can significantly impact an organization’s ability to derive actionable insights and drive informed decision-making. By carefully considering scalability, flexibility, security, integration, ease of use, automation, performance, cost, and support, organizations can empower their teams to unlock the full potential of their data assets while maintaining efficiency, accuracy, and data security.
AI Impacts of Data Profiling: Pros and Cons
Artificial Intelligence (AI) amplifies the capabilities of data profiling, offering unparalleled insights.
The pros include:
- Automation: AI-driven tools automate the data profiling process, accelerating analysis and decision-making.
- Predictive Analytics: AI algorithms predict data patterns and trends, enabling proactive strategies.
- Enhanced Accuracy: AI minimizes human error and bias, ensuring more reliable profiling outcomes.
However, concerns regarding AI-driven data profiling include potential biases embedded in algorithms, data privacy risks, and the need for continuous monitoring to prevent algorithmic drift.
The Future of Data Profiling
As data volumes continue to soar, the future of data profiling holds immense promise. Advancements in AI, machine learning, and automation will revolutionize data profiling, making it more agile, accurate, and accessible. Organizations will harness predictive analytics and real-time insights to drive strategic decisions and fuel innovation.
5-Step Approach to Data Profiling
Organizations should adopt a holistic approach to data profiling, encompassing the following steps:
- Assessment: Evaluate existing data assets, identifying strengths, weaknesses, and areas for improvement.
- Planning: Develop a comprehensive profiling strategy, outlining objectives, methodologies, and resource requirements.
- Execution: Implement profiling activities systematically, leveraging appropriate tools and techniques.
- Analysis: Interpret profiling results, extracting actionable insights to inform decision-making.
- Continuous Improvement: Iterate and refine profiling processes based on feedback and evolving business needs.
In conclusion, data profiling is not merely a technical endeavor—it’s a strategic imperative for organizations aiming to thrive in the data-driven landscape. By embracing data profiling, leaders can unlock the full potential of their data assets, driving growth, innovation, and competitive advantage while upholding the highest standards of privacy and compliance.
Ensuring Data Quality Through Profiling with BigID
For organizations looking to automate data profiling and eliminate the need for manual queries— BigID has you covered. Our data-centric approach to privacy, security, compliance, and AI data management has made us the industry leading platform. BigID combines deep data discovery, next-gen data classification, and risk management all in a holistic platform.
With BigID you can:
- Know Your Data: The ability to identify your data is the first critical step in every privacy and security framework. In order to reduce risk, organizations need to identify all their data, everywhere. BigID’s data discovery and classification helps organizations automatically identify their sensitive, personal, and regulated data across the entire data landscape.
- Data Classification: Classify by category, type, sensitivity, policy, and more with BigID’s advanced data classification capabilities.
- Reduce Risk: Manage access to sensitive and critical business data – organizations need to incorporate access control to identify who has (and who should have) access to sensitive data. BigID’s Access Intelligence App helps organizations identify and remediate high-risk data access issues with ML-based insight to identify and prioritize file access risk.
- Incident Response: When incidents happen, every second counts. BigID’s identity- aware breach analysis effectively assesses the scope and magnitude of a data breach. Quickly determine which users and personal data have been compromised and respond accordingly.
Book a 1:1 demo with our data experts to see how BigID can accelerate your data profiling initiatives today.